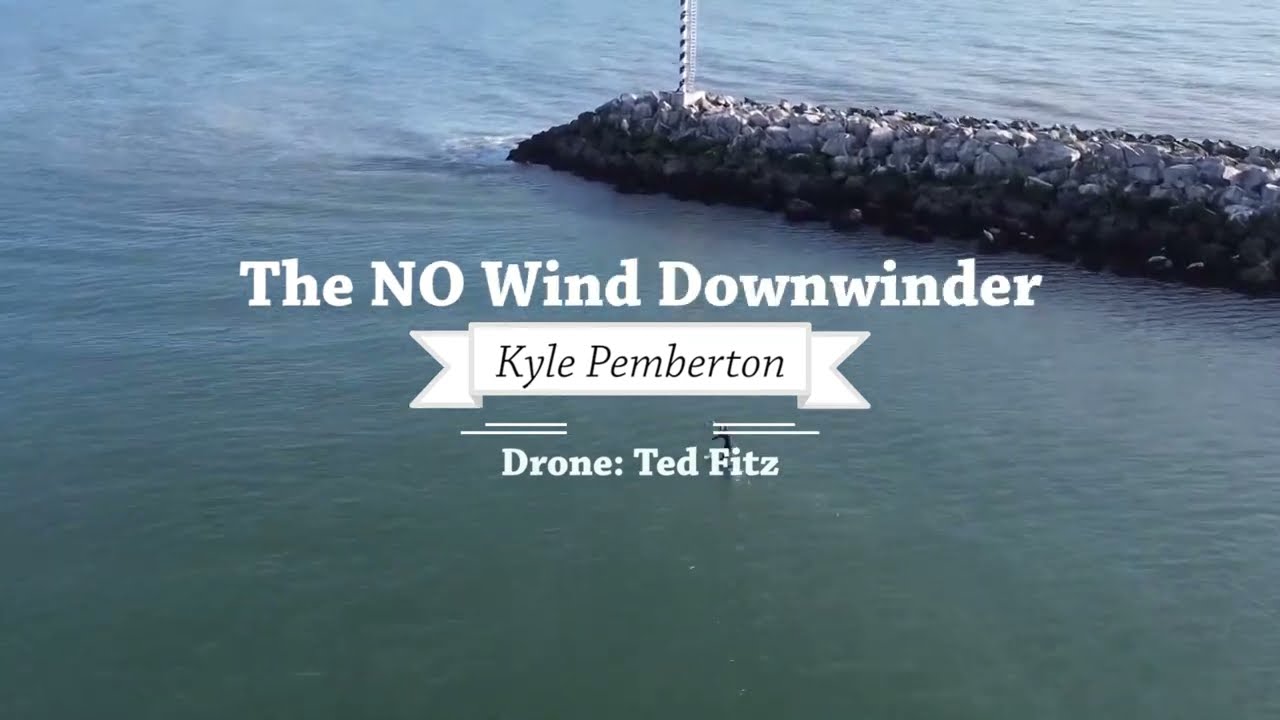
Here is an drone view of what 1/2 the run can look like on a decent day extending from the Harbor Entrance to Surfers beach at the Princeton Jetty. I would say this is 6/10. Kyle Pemberton is riding here and he is very talented. I believe he was on the Axis 1121.
I think I would opt to just paddle out on the inside of the breakwater and do 1/2 runs, you’d probably clock about 1:2 time foiling vs. paddling out.
Personally I would probably just walk the jetty with a 7L pumpfoil as it looks fairly walkable, might not be any faster than paddling on the inside though as you still have to hop from rock to rock.
The Harbor Lap is a great intro to the downwind potential but the Scooter Downwind Loop evolved from that original course to reduce paddle time. Here were some tracks when I did a second run and figured it wouldn’t take that long. Starting from the Green and ending up at the Blue marker at my house still took 1 hour and only included 1 mile of downwind foiling for 6 1/2 miles of transit.
The end objective is to limit paddling time as much as possible because it is the slowest element of the journey.
I had been doing a version of this lap for 2 years. Then I got the scooter on Feb 20th, 2025 unboxed it an immediately did this run. However I didn’t post anything until I felt I had the ability to Tell the Story. I have tracked all my sessions with the Waterspeed iWatch app (& DawnPatrol) for 7 years. Waterspeed allows for a CSV file to be downloaded with Latitude and Longitude coordinates at 1 Hertz. I have used this data before to build various systems but thought I would take the opportunity to Build an AI Agent from the data. The agent was what was used to build the bespoke view on the NOAA chart. I had wanted to build this type of visual aide, showing surf tracks over Reef Lines for years. Today’s AI technology with an electric bike, $189 scooter, Axis Fireball 1350 & 40 skinny tail, on an 11 lbs homemade board and dusting of magical Northwest swell made this possible:
To visualize GPS tracks from Waterspeed CSV files on a NOAA nautical chart for Half Moon Bay, I built a custom web-based CesiumJS viewer and a refined CSV-to-CZML converter.
I began by analyzing the Waterspeed CSV structure, identifying key columns for time, latitude, and longitude. From this, I created a “v12-style refined” CZML format featuring three elements: a green moving dot representing current position, a red trail showing the last 180 seconds of movement, and a persistent magenta (previously yellow) line showing the full historical path. This combination provides clear real-time tracking with historical context.
Next, I overlaid a high-resolution NOAA nautical chart of Half Moon Bay by anchoring a JPEG image using SingleTileImageryProvider in Cesium. To align the chart precisely, I built an interactive tuning tool with sliders and input boxes that allowed real-time adjustment of the image’s bounding box (west, south, east, north coordinates). After fine-tuning, I locked in the final rectangle:
West: -122.5308, South: 37.4670, East: -122.4415, North: 37.5158.
To streamline future sessions, I built a standalone Python script (agent) that automatically converts CSVs into CZML files using the refined v12 template. A User can simply drop CSVs into a specified input folder, run the script, and receive ready-to-use CZML files in the output folder.
The result is a portable, offline, browser-based HTML viewer that overlays personalized GPS data on a navigational map. This system provides clear, replayable surf or foil tracks over a custom georeferenced chart, useful for training analysis, route comparison, and digital journaling.


